|
Bitcoin, Ethereum, Dogecoin-- you might have heard about these crypto currencies recently and wondered what's going on. We enlisted the help of Alex Strain of Bitwise Investments who arranged an interview with their Director of Research, David Lawant, to get a clearer picture of what is happening in the world of Crypto. If you don't know what Bitcoin is and want to learn, we have recorded the video conversation for you.
0 Comments
 Are you staying awake at night worrying about the state of your stock investing? Our fee-only Certified Financial Planner has sound investment advice on when you should revisit your financial plan and when you should simply roll over, plump your pillow, and go back to getting some much-needed rest. It has been a truly turbulent year filled with unprecedented events and wild swings in the American economy and global financial markets. As trusted, fee-only Fiduciary financial planners, we field many calls from new clients who are suddenly very worried about their mutual funds investment, asset management, risk management, and more. There are times when reassessing your investment portfolio makes sense. But believe it or not, a stock market crash—heck, even a global pandemic—may not be one of those times. Before you call your Certified Financial Planner to pitch your current portfolio and put everything into a high yield savings account, ask yourself a few questions. Do you have a personal financial plan in place?Building wealth with assets takes smart financial planning, and a good Certified Financial Planner plans for the unexpected. At Oak Street Advisors, our long-range forecasts for our clients always assume a few years of harder times. No matter what you see on the news, if you have a good, long-term financial plan with the right level of risk management, you are probably still on track to meet your personal financial goals. And if the landscape has shifted in ways that make a difference to your asset management, you should not have to make the first call. A good financial planner will reach out to you!
If you don’t have a personalized financial plan in place, the time to reach out for fee-only investment portfolio advice is right now. Are you considering or experiencing a life-changing event?It may surprise you to hear that the most seismic events in your financial life are likely to be personal, not global. Are you thinking about getting married? Do you have a first child or a new child on the way? Are you contemplating a divorce? Have you been diagnosed with a significant illness or been in an accident? Have you been recently widowed?
Your Certified Financial Planner will most likely not hear about some of these changes in your life unless you share the news directly. Whether the news is good, we will adjust your financial plan to maximize its value. If the news is bad, we will minimize its impact on your long-term financial goals. (And no matter what, we care about you and want to know how you are doing.) Has your personal financial outlook changed? Seeing the stock market swoon or the jobless numbers rise on the news is one thing. Having your own (or your spouse’s) compensation cut or being offered an early retirement package or losing your current position is quite another. Now, it’s personal—and it will likely impact your financial plan. There are less catastrophic shifts in your finances that can also change your long-term financial forecast. Are you enrolling a child in private school? Is one of your children starting, or stepping away from, their college education? Have you decided to retire early, or buy a big boat, or invest in a second home or timeshare?
We can help! Your Certified Financial Planner has strategies to get you through short-term or long-term hardships. We can advise you on how to leverage your investment portfolio to access cash, we can let you know if you can take an early retirement, and we can show you how to adjust your personal financial plan to still meet your retirement goals. We can also show you how to roll over a 529 college savings plan to another child in your family or use it to shelter private school tuition from some taxation. Are you worried you are missing out on a big opportunity?Did one of your best friends share a tip about a hot new stock? Does your co-worker have a different investment strategy that they are sure will really pay off? It can be difficult to hear success stories at the office or the neighborhood barbecue without wondering if their advice might also be good for you. As fee-only Certified Financial Planners, we focus on long term investment strategies rather than the outlook of individual stocks. If we see a big opportunity, we will always let you know, and if you are intrigued by a particular stock, we will encourage you to speak to your investment advisor for investment portfolio advice. FOMO—or Fear of Missing Out—drives more terrible investment decisions than most people realize. By the time you are hearing about the success of a particular stock, it is likely ready to plateau or plunge, and someone else’s retirement plan is not designed around your personal financial situation and financial goals. Remember: you don’t have to take risks just to take risks. Staying on track to a comfortable retirement is a real reward. Have tax laws changed?
Has it been more than a year since you reviewed your plan with your financial advisor?Oak Street’s fee-only Certified Financial Planners build in an annual review of every single one of our client’s personal financial plans to ensure they are optimized for the coming year. And if we see trouble or opportunities ahead? We will sit down with you, share our years of experience, and reset your personal financial plan to ensure that you still reach those long-term goals.
Many investors love the Federally tax-free income they receive from municipal bonds. Municipal bonds are debt securities issued by state and local governments to fund operations or special projects. Because the income an investor receives is not taxed, the after-tax return of municipal debt is often higher than the after-tax income provided by corporate bonds and bank CDs. For example, the yield on the iShares Core US Aggregate Bond ETF (AGG) currently stands at about 2.3%. For a taxpayer subject to a 22% marginal income tax rate, the after-tax return drops to just 1.8% and is even lower as you climb into higher marginal tax brackets. Compare this to the Vanguard Tax-Exempt Bond Index Fund ETF (VTEB) which yields 2.1% federally income tax free. An often-underappreciated item in the US income tax code deals with qualified dividends. A qualified dividend is a dividend from a common stock or a preferred stock that the filer owns for a specified minimum time period. The beauty of qualified dividends is that they are taxed at the filer's long-term capital gains rate rather than as ordinary income. The following table compares ordinary income rates and long-term capital gains rates for married filing jointly returns for the tax year 2021
*Includes 3.8% net investment income surcharge.
Which brings us to the value of qualified dividend income (QDI). QDI extends to income received from preferred securities. Preferred stocks are debt-like securities issued by corporations that rank below the bond holders-- but above the stockholders-- in the event of a liquidation. The term preferred is used because the dividends on these shares must be paid in preference to dividends paid to common stock shareholders. To learn more about preferred stocks you can view the Wikipedia entry here. The importance of this is the after-tax returns of many preferred securities held long enough to receive QDI tax treatment, are higher than rates generally available in the municipal bond market. Take the Bank of America preferred series A (BAC-PA) for example. This security has a current dividend yield of 5.8%, even at the highest capital gain rate of 20% and add in the 3.8% net investment income surcharge the after-tax net on this income is 4.4% or more than double the tax-free rate of 2.1% from VTEB. There are some details to keep in mind; to qualify for QDI status, the security must be held for 91 days out of the 181-day period, beginning 90 days before the ex-dividend date. Because most preferred securities pay quarterly dividends, you would generally need to make your purchase the day of the preferred trade’s ex-dividend to ensure you receive favorable tax treatment. Also, preferred issues are highly concentrated in the financial and utility sectors of the market which could lead to poor diversification. You could use exchange traded funds (ETFs) like the iShares Preferred and Income Securities ETF (PFF) or an open-end mutual fund like the Nuveen Preferred Securities and Income Fund; but be aware that not all the distributions from funds like these are considered Qualified Dividend Income. Only 62% of the distributions from PFF were eligible for QDI treatment in 2018 and usually about 60% of the Nuveen funds distributions were QDI eligible. Still, for investors concerned with building a tax-efficient portfolio, preferred securities are certainly worth consideration. There’s an old story in the investment industry that may be true or may be just a parable--but it certainly is appropriate to remember when the stock market is panicking. The story goes, a very smart advisor would tell each of the investors who opened an account with her the following:
But wait--
While that’s a good story, and one we tell often, it’s not the whole picture. If you wait for the perfect time to invest, you’ll likely miss many, many, days, weeks, months, or even years of good growth in the market. We believe a better answer to the “When is the perfect time to invest?” question is: “ASAP”. The magic of compound interest works best for you many years down the road. Every day you delay is a day you put off that magic coming to fruition. Not to get into the math, but you can imagine that 21 years of compounding growth produces a higher number than just 20 years of compound growth. If you take the time to do the math, you might be amazed at what one extra year of compounded growth means in dollar terms. And my answer of as soon as possible also comes with some conditions. Get a financial plan. Developing a real financial plan means understanding all, or at least most of, the risks equity investing presents. Knowing the correct asset allocation is paramount. Too little risk and you may have no chance of reaching your goals, too much risk and you’ll find yourself outside our window with a rock in your hand. Having a real financial plan gives you discipline, and in investing, discipline is your friend. A real financial plan gives you confidence that no matter what happens in the short-term, you will be okay in the end. A real financial plan makes life simpler. If you find yourself with extra money to add to your portfolio, you don’t have to reinvent the wheel or come up with some new idea. Your plan already shows you where your money should go. If stocks soar, your plan will tell you when to pull back; if stocks sink, your plan will force you to make the hard decision of “should I buy more”. A real financial plan provides a more tax-efficiency investment strategy, which gets you where you want to be faster-- and with less risk. Investing with poor tax planning is like driving your car with the parking brake on-- it slows you down and ruins your car. If you don’t have a plan, it’s unlikely you have done an adequate job of educating yourself about how markets and money work either. Folks often fail when they follow a “get a hunch, bet a bunch” strategy. Sure, you hear stories of someone who bet all their money on some company you have never heard of and made a fortune. You have also heard stories of folks who won the lottery and became rich overnight; that doesn’t make buying lottery tickets a sound investment strategy. So, while I love the story about the brick, I think it misses the bigger picture. Planning, and executing your plan, will create the perfect time to invest. Remember, it wasn’t raining when Noah built the Ark. I don't want to add flames to the fire regarding the new coronavirus-- COVID-19, however, the time to have a lifeboat drill is prior to the ship sinking. Investors should contemplate what this virus can do to the markets and world economies while they are still thinking rationally, rather than waiting until widespread panic clouds their judgement. The COVID-19 is the same type of virus as the common cold, but it’s definitely not common. It is a strain that is new in humans, so we, as a species, have not developed antibodies to fight it, and there is no herd immunity to slow its contagion. Rather than turn to Facebook or the popular press for answers, we recommend you visit the Center for Disease Control web site for more detailed information on what COVID-19 is and the threat it poses. Early data shows a high fatality rate-- somewhere around 2%; but keep in mind this data could well be skewed because diagnosing those infected is rudimentary at best. We are aware of nearly 100% of the fatalities but the number of cases of infection could be vastly under-reported. A coronavirus is a cold, and except in the most serious cases, likely to pass with little notice. You’re probably aware that drug companies around the world are trying to find a vaccine. We wouldn’t hold out much hope on this front as we have been trying to find a cure for the common cold for decades with zero success. In the past week, we’ve seen the US Stock market drop by about 10% as concerns over COVID-19 have swept the globe. While markets usually do a very good job of pricing risk and opportunity, there are times when rationality tips to panic, and markets no longer function as they should. The most recent example of this was the 2008-2009 period when markets lost half of their value based on panic that the world was ending. They would eventually rebound fourfold as panic subsided and rational thought came back to the forefront. So, is the pullback, so far, a rational repricing of risk/opportunity? Or is it the beginning of a panic? We believe it is too soon to tell. Some companies have already announced that the COVID-19 is having an effect on their sales and earnings. Microsoft and Apple have noted problems with their supply chains. As market participants try to peer into the future, they’ve battered the travel and energy sectors, expecting consumers to avoid travel. As fear spreads this will work its way into the restaurant sector, fear of contagion may cause consumers to avoid crowded spaces where the virus could be easily transmitted. On a more basic level missed workdays and a drop in productivity could potentially hurt businesses of every type. S&P 500 2010-Present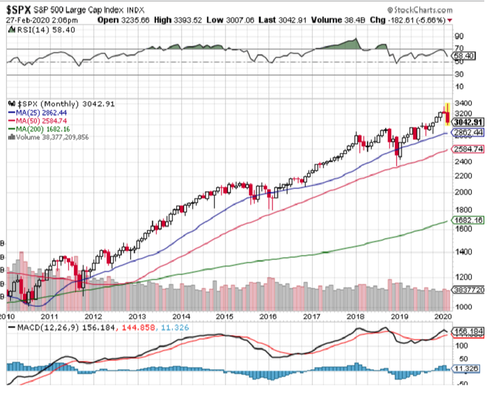 The stock market has had an incredible run over the past 14 months, reaching new highs at almost a monthly pace. The technical indicators we follow showed the market nearing overbought levels on a short-term basis prior to the recent drop. So, a pullback was not unexpected-- with or without the COVID-19 outbreak. That doesn’t mean we expect a reversal, but it does mean we would not expect a continuation of these 2%-3% per-day drops. From a technical perspective, a pullback to around 2,600 for the S&P 500 would not be overly concerning. If markets stabilize on a short-term basis, there are gaps in index price levels that will be filled. So, in fact, we could soon have a very good buying opportunity for long-term investors with cash to allocate to stocks. S&P 500 Last 6 Months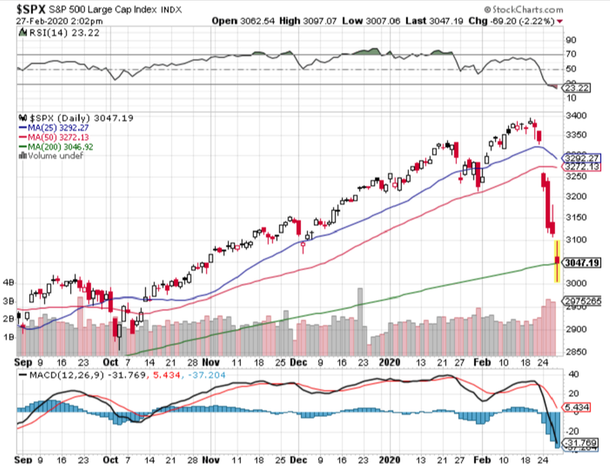 What Should a Rational Investor Do?Nothing. Rational investors know that their default position should always be to remain fully invested. It is too soon to tell if this is a normal market adjustment to new information, or the beginning of a panic. For those with reasonable investment time frames, this will be a barely noticeable blip on the long-term chart of their investment history.
In the short term there will be times when investors doubt themselves. This is normal. We believe thinking about this problem now and preparing for an uncertain future can only help long-term investors achieve their long-term goals. It’s been a stellar start to the year. The S&P 500 has risen nearly 20%--crossing the 3,000 mark for the first time on June 12th, 2019. 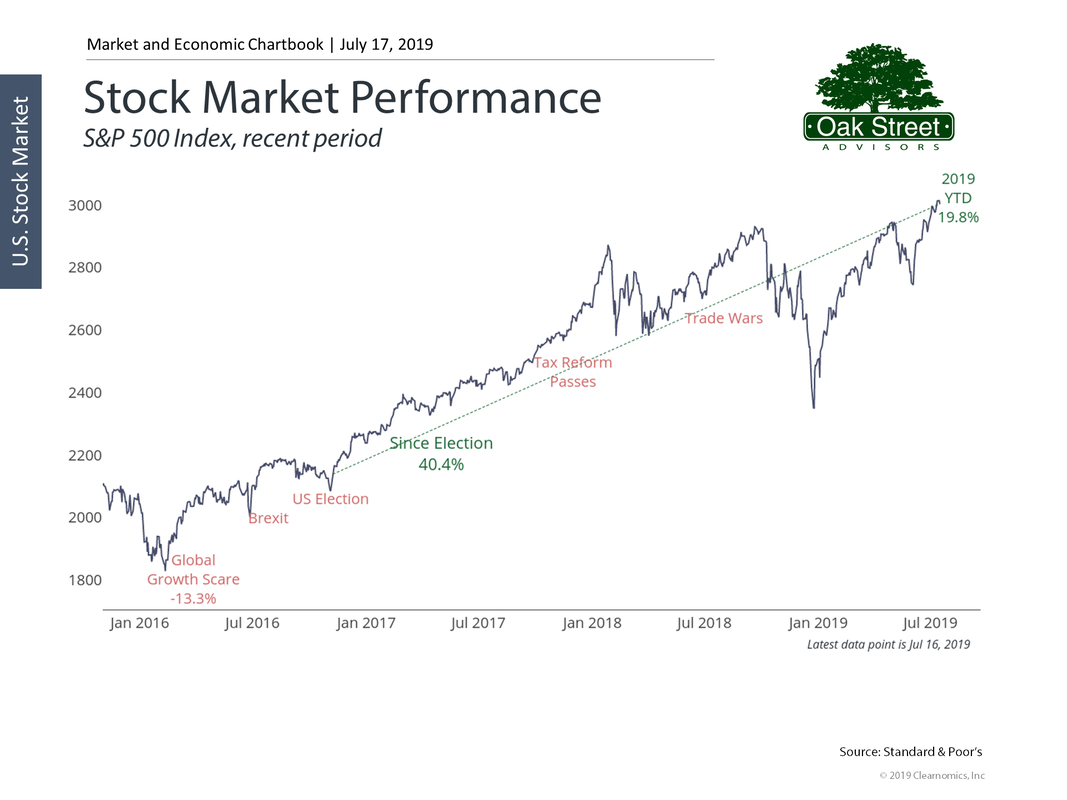 Stock market valuations are getting a bit high and investor confidence remains unchecked. 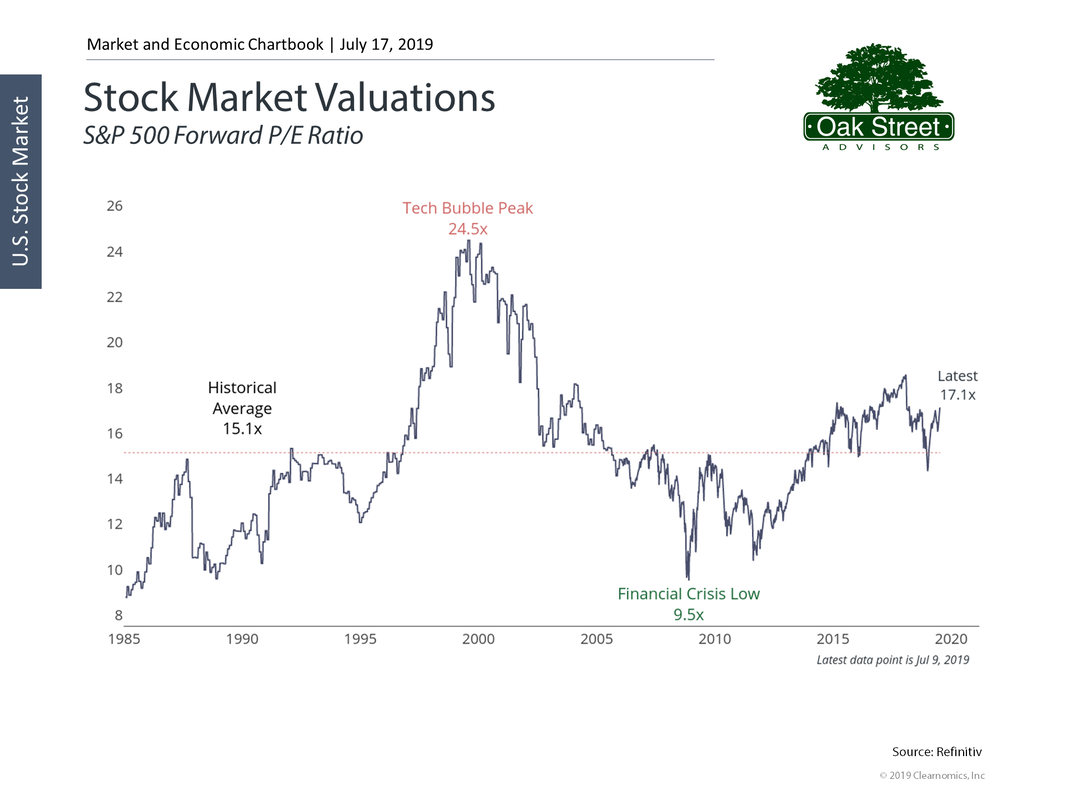 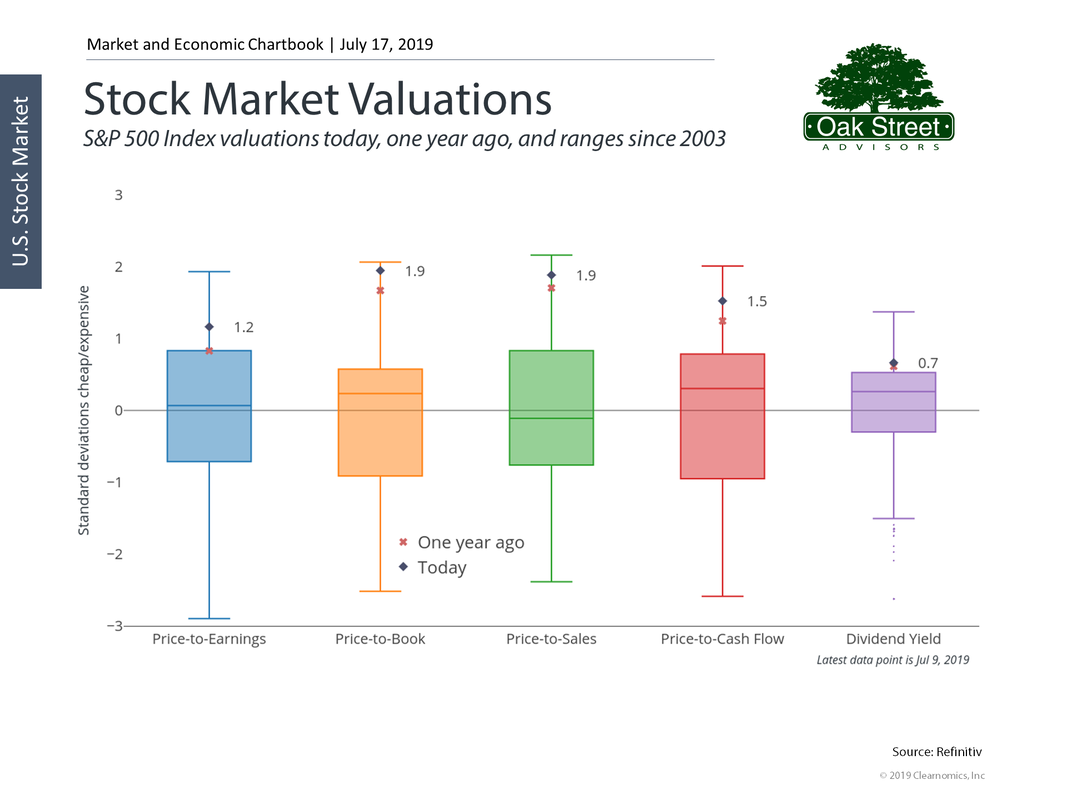 While corporate earnings growth is slowing. 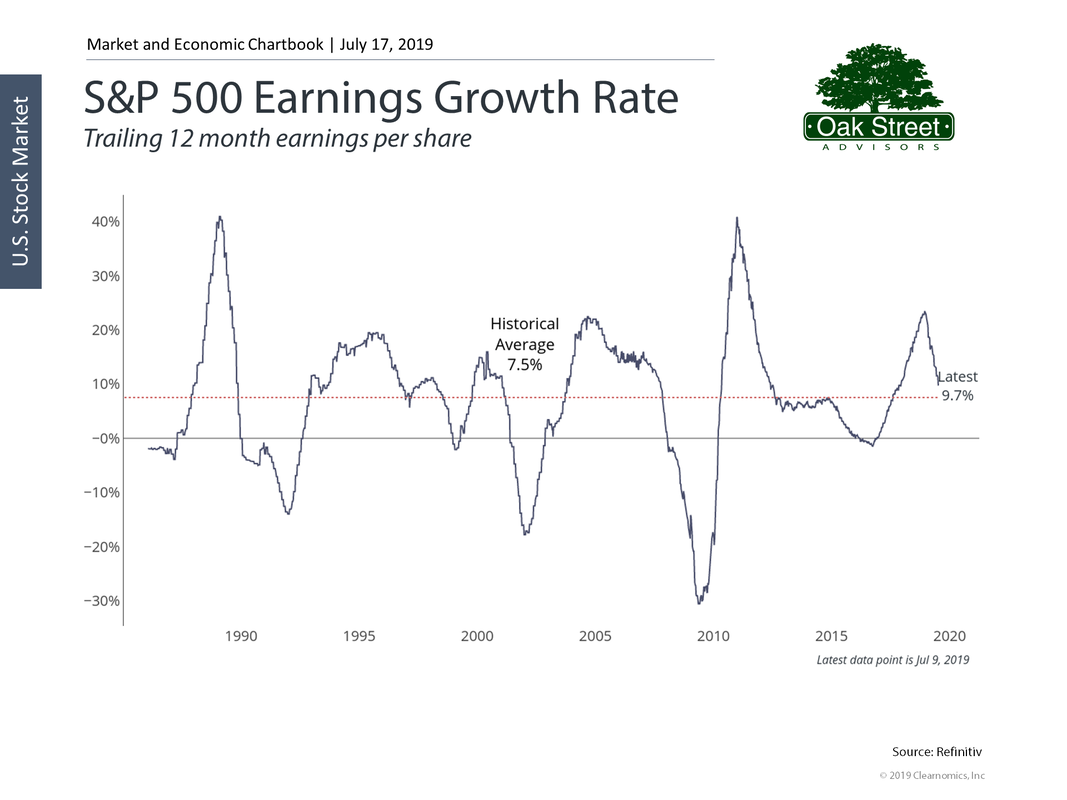 And as a contrarian indicator, investors remain very upbeat about the market… 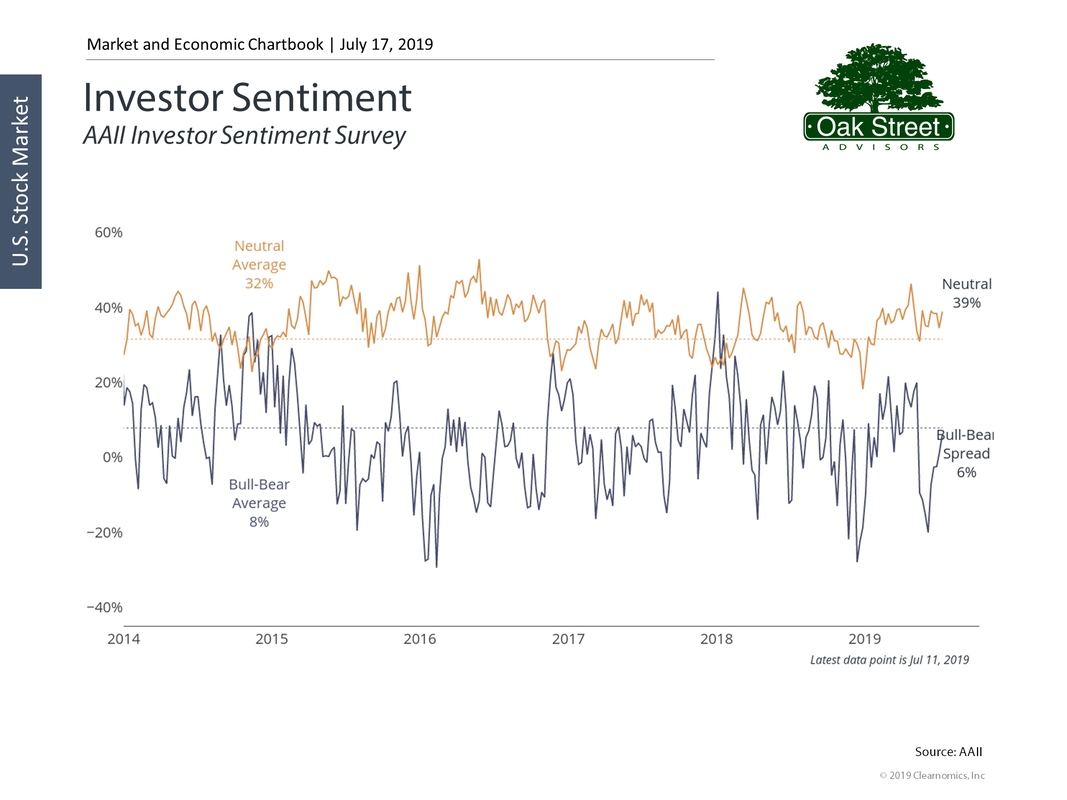 …while volatility remains low. 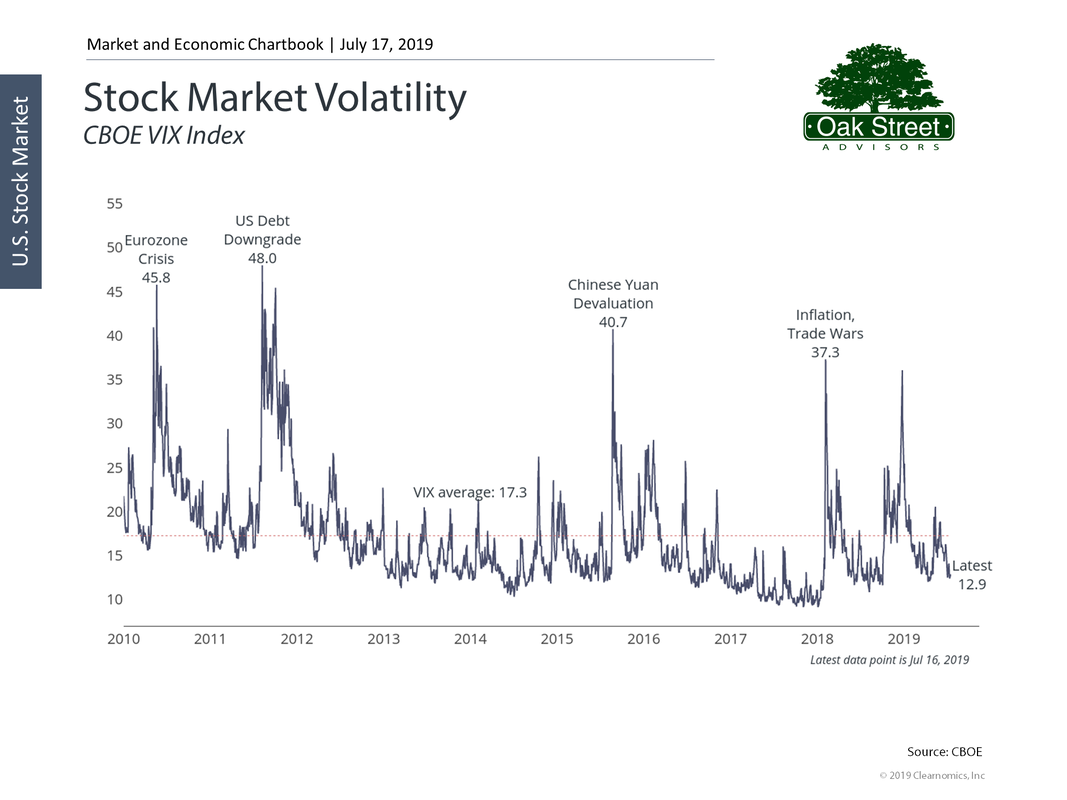 The Fed seems to be caving to political pressure and markets believe we’ll get one or two rate cuts during the second half of 2019. The yield curve has avoided a major inversion as short-term rates have continued to fall. 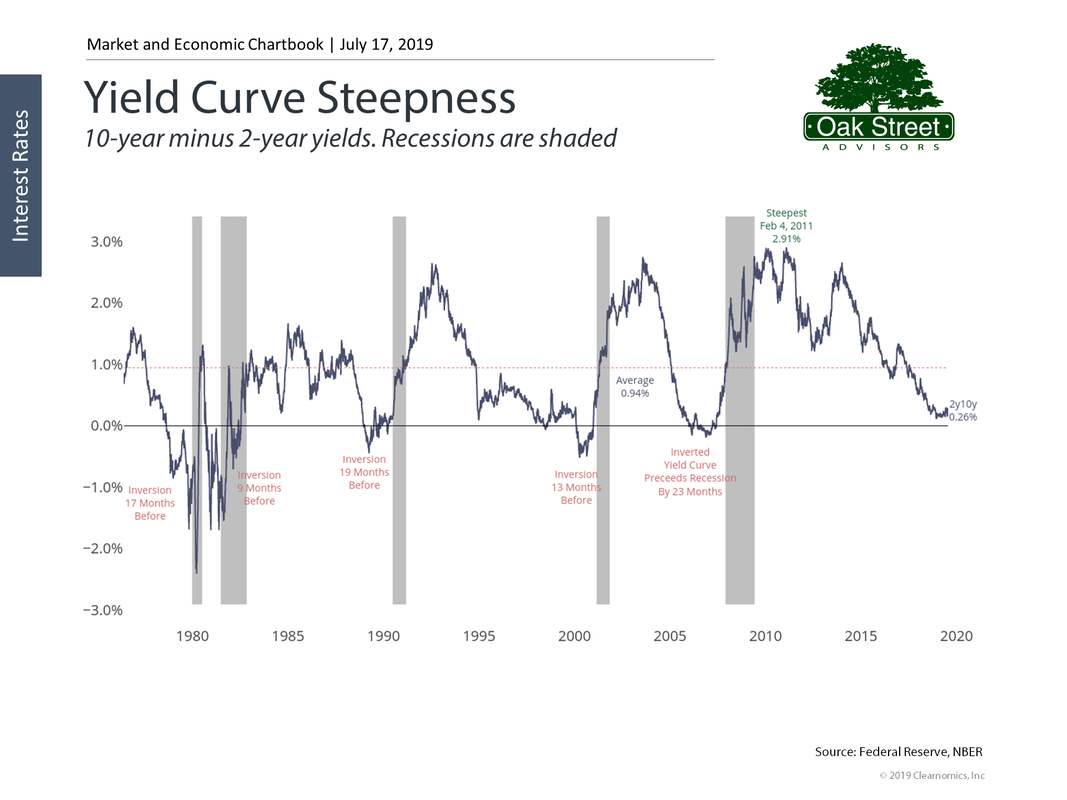 Other things that we find worrisome: Treasury Secretary Mnuchin indicated the government may run out of funds by early September. However, Congress is scheduled for a summer recess and politicians seem to be more divided than ever so the Federal budget could become a big deal.  Although the markets seem to have priced-in an easing of trade tensions, there may be no quick end to the US trade war with China  Here’s What Oak Street Advisors is Doing Now:
When making any decisions we need to ask ourselves “Can I afford to be wrong?”. The long-term lesson of the markets dictates that our default position should be fully invested. The markets may go down-- but they do not stay down-- and the price of the permanent ups is the short-term downs. With that said, and knowing we may be wrong, we have made some changes to our stock portfolios. We’ve taken about 10% out of the stock allocation in the equity portion of your portfolio and are holding those funds as extra cash positions. This means if the stock market were to gain an additional 10% from now until year-end, we would only achieve a 9% gain. However, if the market were to pull back from here by 10%, we would only fall the same 9% and would have cash available to reinvest at lower prices. Only time will tell if our caution is justified. Note. This information does not constitute investment advice. It is merely posted so clients can understand the thought process that goes into managing their portfolios. Each individual’s circumstances and needs are unique. No one can predict the future or the valuation of any financial market with accuracy. Over the course of my thirty-year career in the financial services industry I have seen and continue to hear many investment theses. Some brilliant, some not so much so. I have also witnessed a number of changes that in retrospect were obvious and inevitable. The personal computer revolution was one of the first. I recall there were many would be winners that vanished into dust, but some of the early players like Intel, Microsoft, and Cisco became the next generation of mega-cap companies. Likewise, with the internet boom. Companies came and went, but some like Amazon and Google became behemoths. Cell phones were the stuff of dreams in my youth, but the ability to access people and information, no matter where you are, was inevitable and although early participants like Nokia and Motorola have become footnotes, Apple and Samsung have had explosive growth and rewarded investors many times over. Recognizing inevitable change is only half of the battle for successfully profiting in new industries and market opportunities. Diversification and patience are more important long-term ingredients to financial success. If you put all your eggs in the Commodore computers basket you were a loser. The same for eToys.com or Lycos, or Palm Inc. Even if you recognized the inevitable, it was still much too easy to lose all or most of your investment. Perhaps, though you were bright enough or lucky enough to pick the winners. On 3/24/1980 you could have bought Intel for just $0.32 adjusted for splits. By 10/20/1980 it had already soared 56% to $0.50. A year later, the price had fallen about 48% to just $0.26 per share. Would you have held on? Would you still have faith that this was inevitable? It wasn’t until the second quarter of 1983 that Intel reached that $0.50 peak again. Today, no one gets very excited about Intel, but the stock price has reached $51 per share netting those long-term patient investors $100,000 for every $1,000 they invested nearly 40 years ago. So, although you can find inevitable investment opportunities, today the rush of the quick pop in price per share will not always be there. Sometimes, it is just waiting, and waiting, and waiting. With those words of warning, we will share with you four inevitable investment opportunities we feel all investors should be considering right now. Cannabis In January of 2012, marijuana became legal for medicinal and recreational use in Colorado. In 2018, it became legal for the entire country of Canada. Around the world attitudes toward “pot” are changing rapidly. We are now witnessing the birth of an entirely new industry. We believe the opportunity is akin to the liquor industry at the end of prohibition, and we are not alone. On November 1, 2018, Constellations Brands (STZ) closed a $5 billion investment in Canadian cannabis producer Canopy Growth (CGC). On August 1, 2018, Molson-Coors (TAP) announced a joint venture with Canadian cannabis company HEXO Corp. (HEXO) to develop non-alcoholic cannabis infused beverages. Additionally, in December of 2018, Philip Morris (PM) invested $2.4 billion in the Canadian cannabis company Cronos (CRON). What do these large multi-national companies see in the future of the cannabis market? Take a look at some of the numbers. 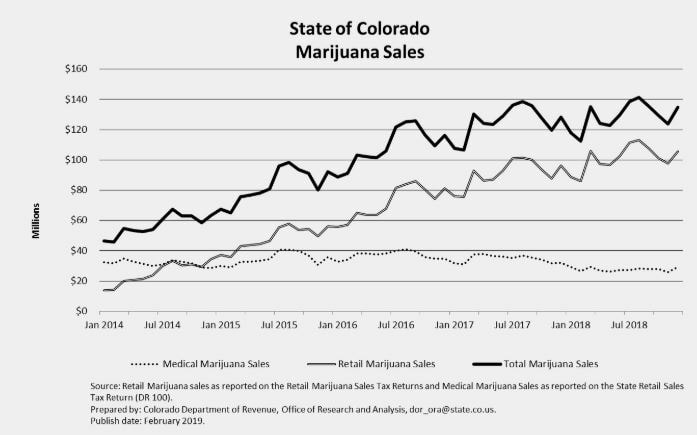 In four and a half years, total sales of cannabis have more than doubled in the state of Colorado, jumping from $683 million to over $1.5 billion. Colorado ranks 21st in the US by population with about 5.7 million residents. That works out to sales of about $263 per year per person. There are now ten states in the US where cannabis is legal for both medicinal and recreational use. This includes California, ranked number 1 by population and Michigan ranked number 10. These states in aggregate have a population of about 80 million. Throw in New Jersey and New York who are likely to follow suit and that means about one third of American’s live in states where cannabis is legal. Even if Colorado is an outlier and sales in other states are only say 70% as high (haha) or $184 per person that works out to a market of $14 billion. Maybe Constellation Brands and Molson-Coors envision a day when you stop by your local pub for a cannabis infused drink rather than a beer. For comparison, the US market for beer topped $35 billion in 2018. Like the acceptance of the lottery, there will be many states reluctant to join the party for moral reasons, but sooner or later acceptance is inevitable. Renewable EnergyNo, you don’t have to be a tree hugger to realize that renewable energy is inevitable. Take a look at this chart from Yahoo Finance showing the fastest growing jobs in every state. 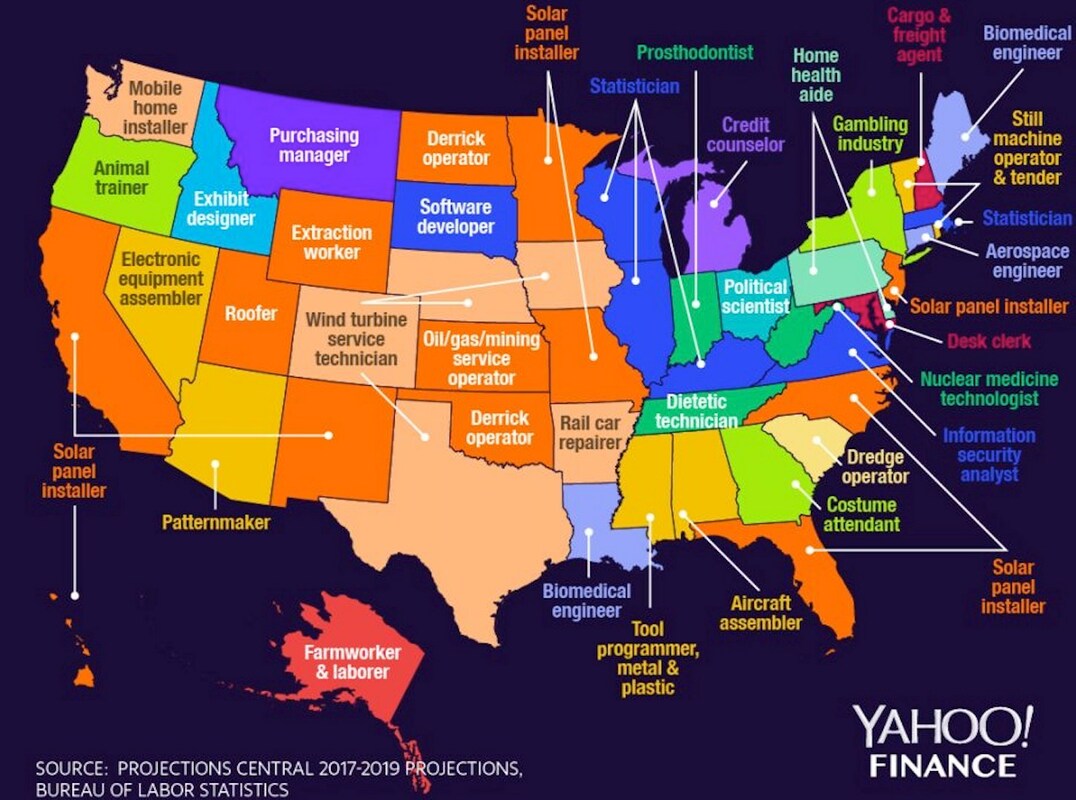 In eight states, the fastest growing job is solar panel installer. In four states, the fastest growing job is wind turbine service technician. Climate change concerns aside, it is obvious renewable energy is becoming a much bigger deal both in the US and abroad. Although, starting from a low base the following chart from the Yale School of Forestry illustrates the beginnings of an explosive growth in solar energy production worldwide. 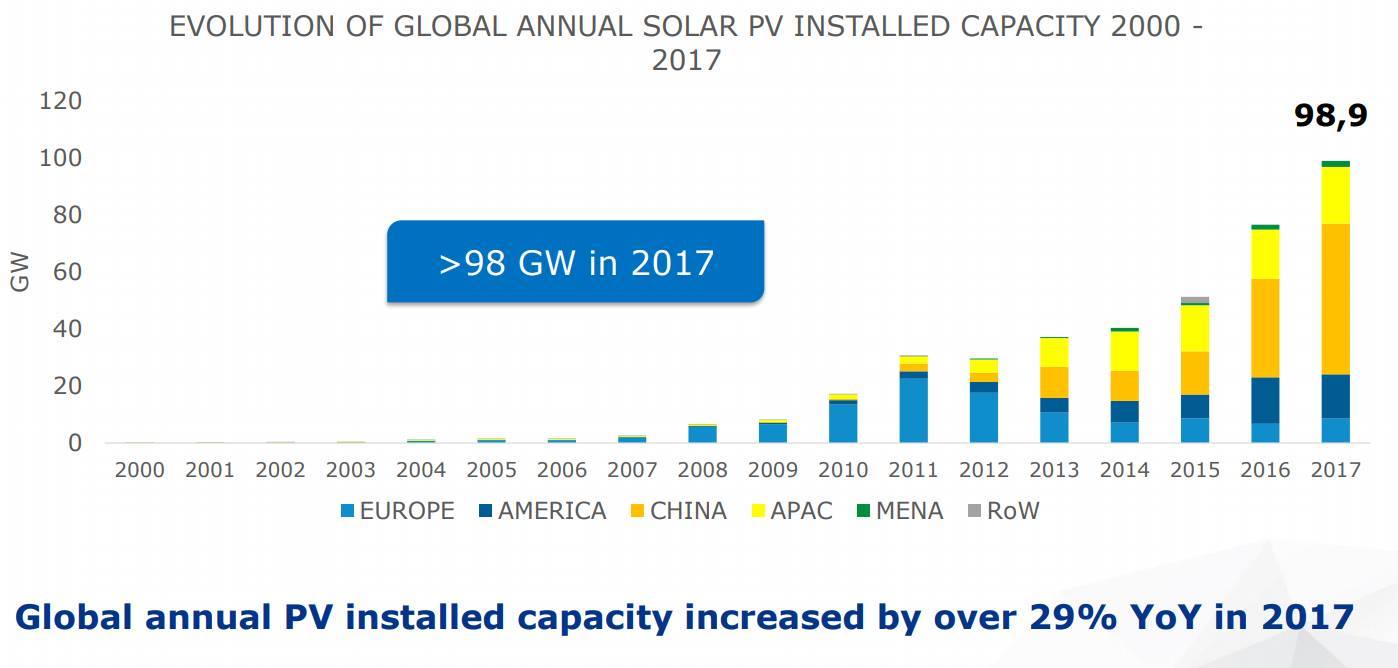 Much like the tipping point in software adoption, we believe solar installation will reach a critical mass that will one day lead to a distributed production model for energy use. With a large installed base of photovoltaic solar panels, today’s electric utility could evolve into a sort of common carrier like the Telcos, moving electricity from areas of high production to areas of high consumption. Your rooftop solar array and the arrays across the nation would provide power for homes and factories across the country. Rather than spending most of their capital on new power generation assets, they might spend more on upgrading and improving the efficiency of our electric grid instead. Both utility scale solar and wind systems currently provide the lowest power costs available. As photovoltaic systems improve, and manufacturing systems evolve, the price will head only one way – down, as illustrated in this chart from Lazard on levelized energy costs. 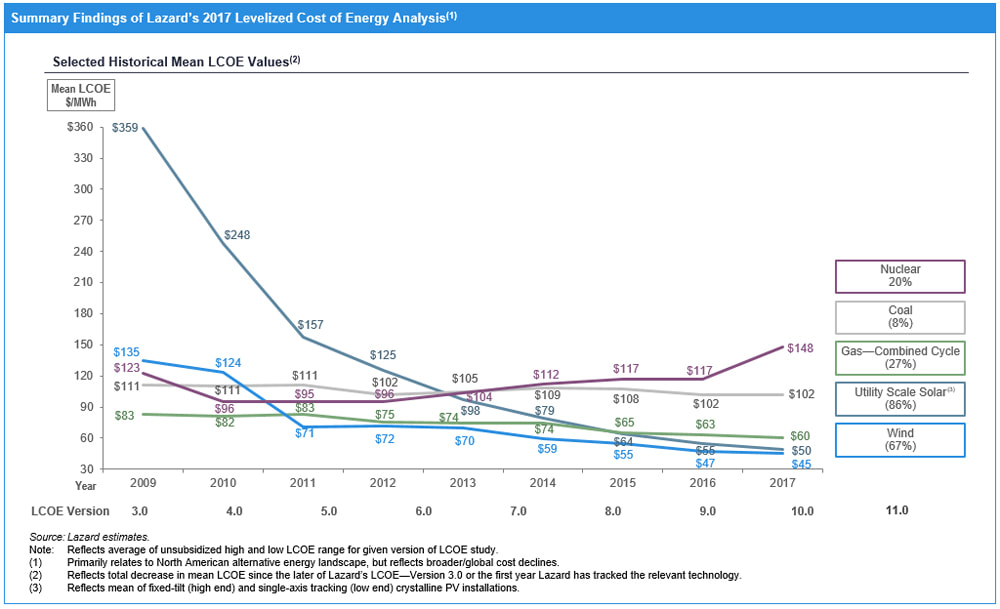 Autonomous VehiclesYou have likely heard about the Tesla (TSLA) cars with autopilot, or maybe Google’s Waymo division. The first generation of self-driving vehicles is nearly here, and it means big change for the entire transportation industry. It will change the way automobiles are used, change the ways roads are built, and change the way freight is shipped. Like most people in America, you own a car that sits parked in your garage or at your place of employment 90% of the time. Cars are expensive. There was a time when the average family could buy a vehicle and pay for that vehicle with three-year financing. Today dealers are stretching that financing out to six or even seven years to make ownership possible. 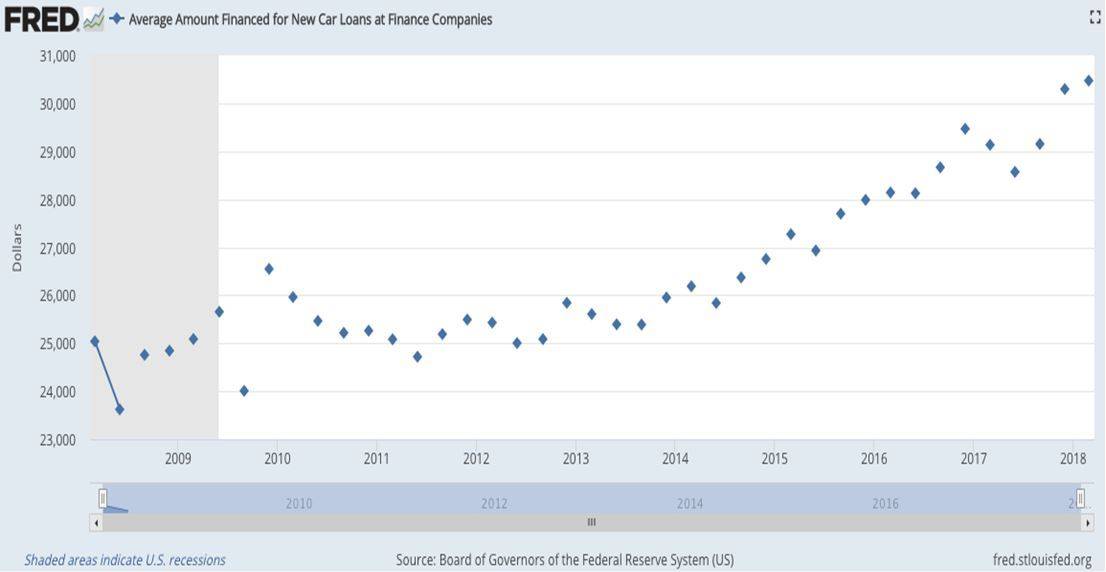 Imagine getting up in the morning and using a smartphone app, you summon your ride to work. On the way you are free to check your email, read the news, or even just nap because you are not driving the vehicle - it is driving itself. In 2018, the average payment for a new car in the US was $523 per month. That doesn’t include insurance, fuel, or maintenance. It is easy to guess that the total cost of car ownership to be around $700 per month. With autonomous vehicles, you would pay only for the time you are using the vehicle and various companies would own fleets of vehicles around the country. They would pay for the maintenance and insurance, you would just rent a ride. Again, once critical mass is reached with autonomous vehicle adoption, our roads would become safer, parking garages would go the way of payphones, and travel becomes less frustrating. How many traffic jams would be eliminated if crashes were rare and rubbernecking were eliminated? Shipping freight will change radically as well. Without the need for human drivers, shipping companies would program their trucks for fuel efficiency rather than speed. Trucks would travel the highways 24/7. If you have ever been on an interstate highway in the wee hours of the morning, you know there is almost no one using the highway. This becomes prime time for shippers, resulting in less congested roads and decreased need for new road construction. For all these reasons and more, we see autonomous vehicles as an inevitable change. The Wilshire 5000 Yep, it’s as simple as that. History has shown that investing is common stocks for the long run inevitably creates wealth. Markets go down but they do not stay down. You don’t have to be a genius or a prognosticator to participate and profit from the inevitable growth generated by a group of great American companies. Back to our question about Intel. Did you buy it? Did you hold it? The Wilshire Index did. Same for Apple, Netflix, Tesla, and many other great and not so great companies. Some companies that were in the index disappeared, but the growth of market value marched on anyway.  The Wilshire 5000 Index is a market cap weighted index of all the actively traded stock on all the US exchanges. Originally named the 5000 because when the index was first constructed in 1977, there were about 5,000 companies actively traded in the US. As of June 30, 2018, there were 3,486 companies in the index. You will find the components of all the inevitable trends we covered here, and some that we may not be aware of included in the index. If new companies come to market in the future, they will be added too. The companies in the index are updated monthly to include IPOs and corporate spinoffs and also to remove companies that move to the pink sheets or cease to trade actively.
Volatility Wow! 2018 went out with a huge rise in volatility as stocks swung from a small gain for the year to nearly reaching bear market territory, before rebounding yet again to end the year down 4.38% as measured by the S&P 500 index 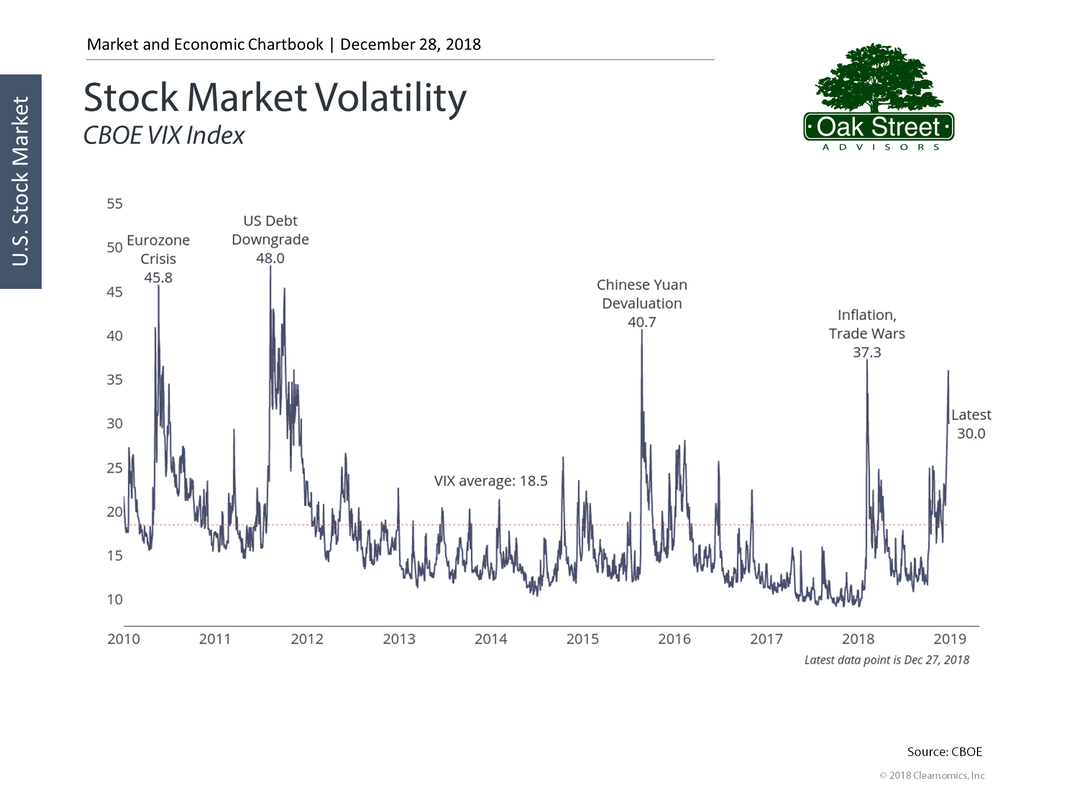 For 2019, you should expect volatility to remain high. Markets will continue to gyrate as we face increasing political uncertainty. The government shutdown will likely become an extended event, as neither side is likely to move much, and negotiating with the executive branch is like trying to eat Jell-O with chopsticks; it wiggles all over the place. While some may find these tactics a refreshing change to the way our government usually works, the markets are likely to be confused by the new normal and react with wild swings based on the latest news cycle. The unpredictability of the current administration will continue to promote volatility as markets react to a constant barrage of headlines and unconventional political tactics. Interest Rates The Federal Reserve raised rates 4 times in 2018, moving the benchmark short-term rate from 1.25% to 2.25%. This resulted in a difficult year for bond investors as fixed income indices fell for the first time since 2013. 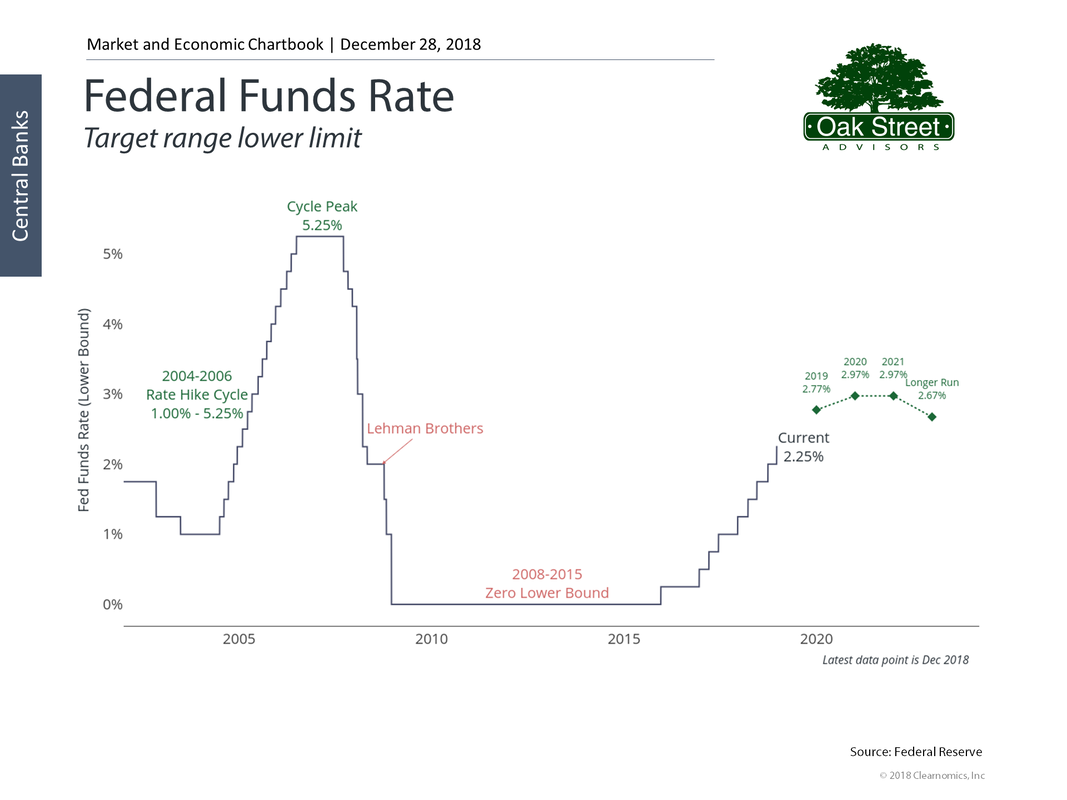 There is also concern about the yield curve. While the yield curve has not inverted yet, it is dangerously close to doing so. The chart below shows the 10-year treasury yield minus the 2-year treasury yield, going back to the 1970s. The shaded areas represent recessions. Historically, an inverted yield curve has presaged recessions and Fed economist David Andolfatto recently argued that an inverted yield curve could actually cause recessions. Regardless of whether an inverted yield curve is a leading indicator or a contributing factor to recessions, being on the cliff’s edge as we are now adds to the uncertainty surrounding markets going into 2019. 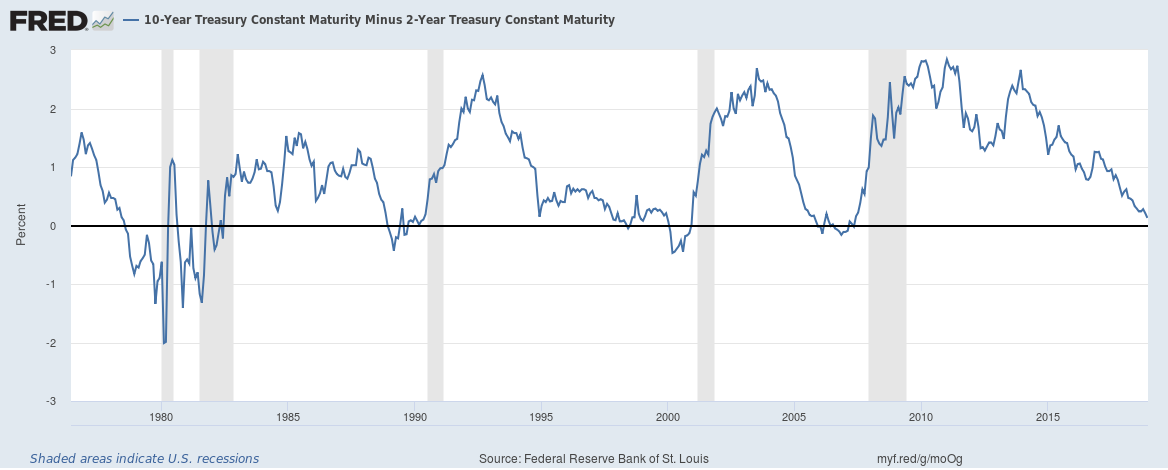 With worries about a possible recession on investors minds, credit quality spreads are finally normalizing after years of compression following the credit crunch of 2008-2009. 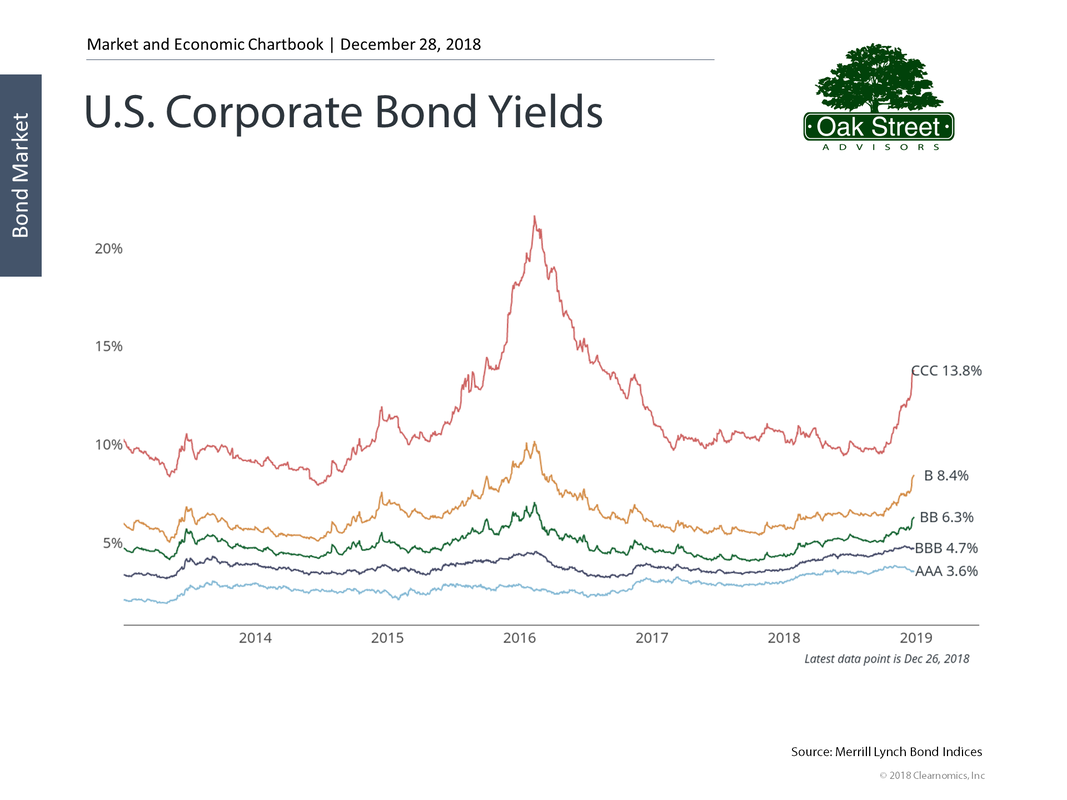 2019 may be the year we finally find some value in high-yield bonds after nearly a decade of tightened credit quality spreads. 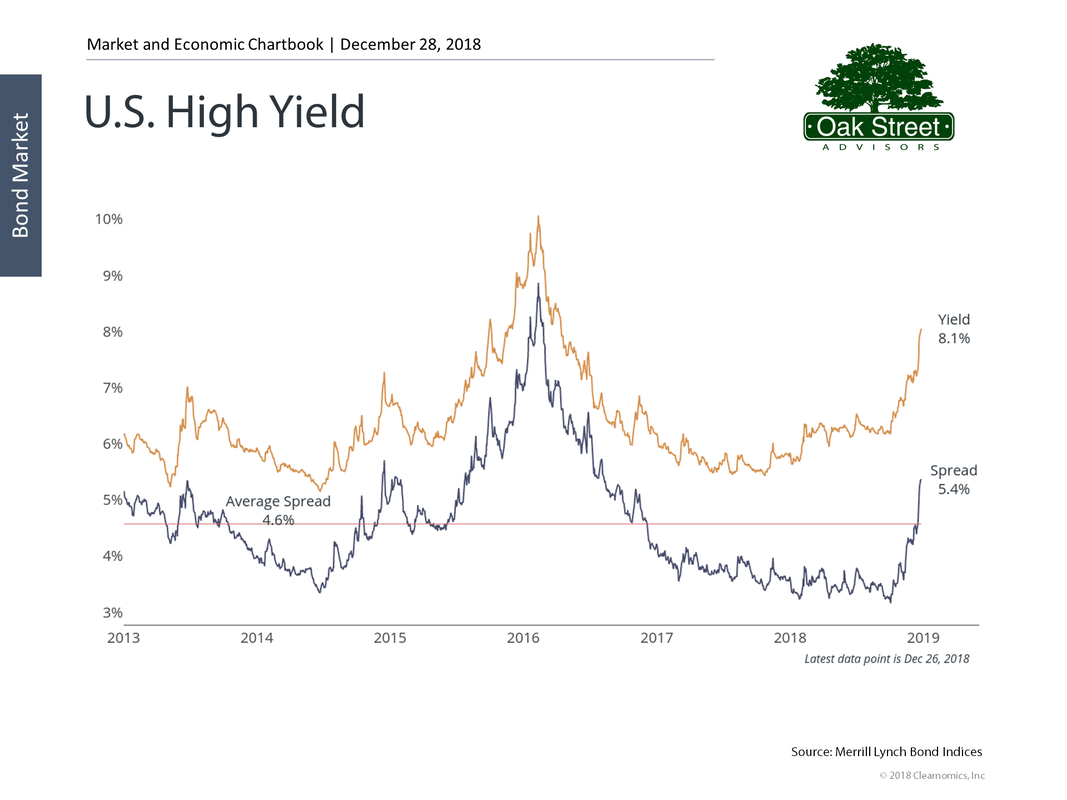 Rising interest rates also leads to a stronger dollar. This makes US produced goods more expensive for foreign buyers and can dampen the earnings of US exporters. 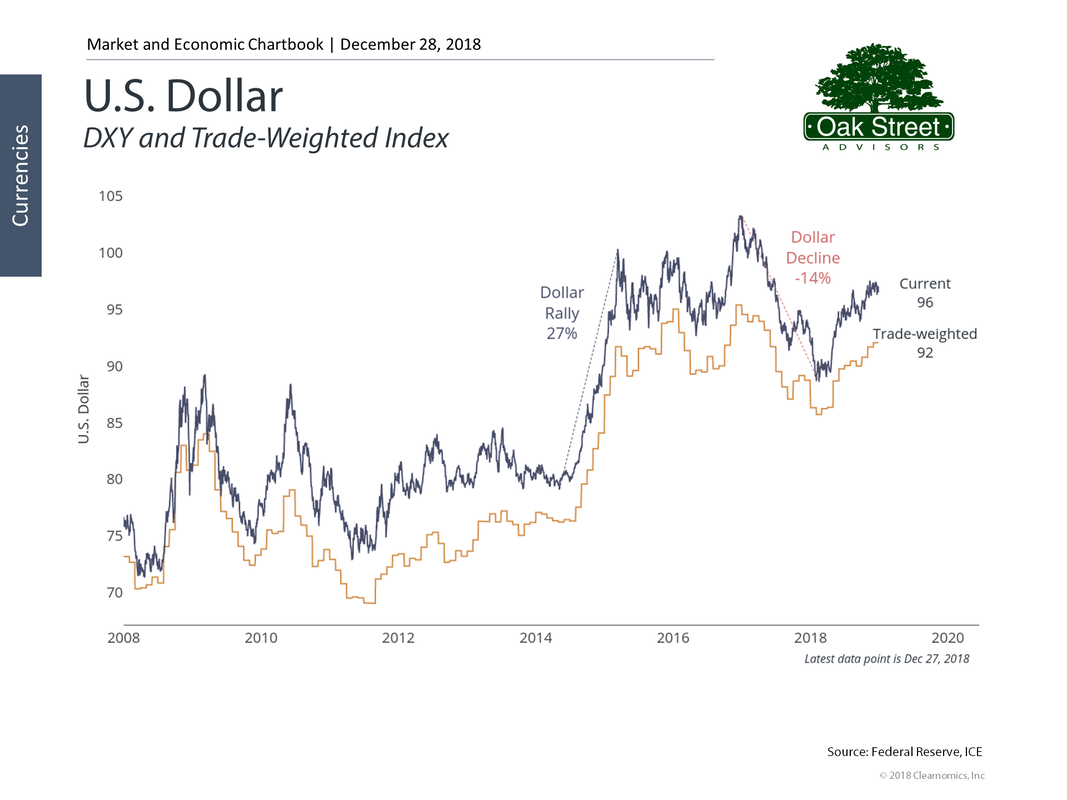 Equity Markets After a fast start in early 2018, the equity markets fell hard in the 4th quarter of the year. Nearly every subcategory of the market ended 2018 in the red. 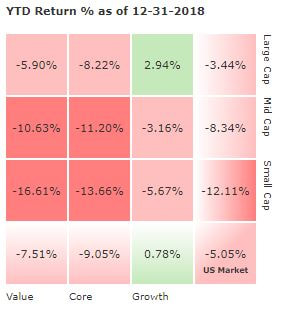 But compared to one year ago, equity valuations have fallen, based on many metrics. 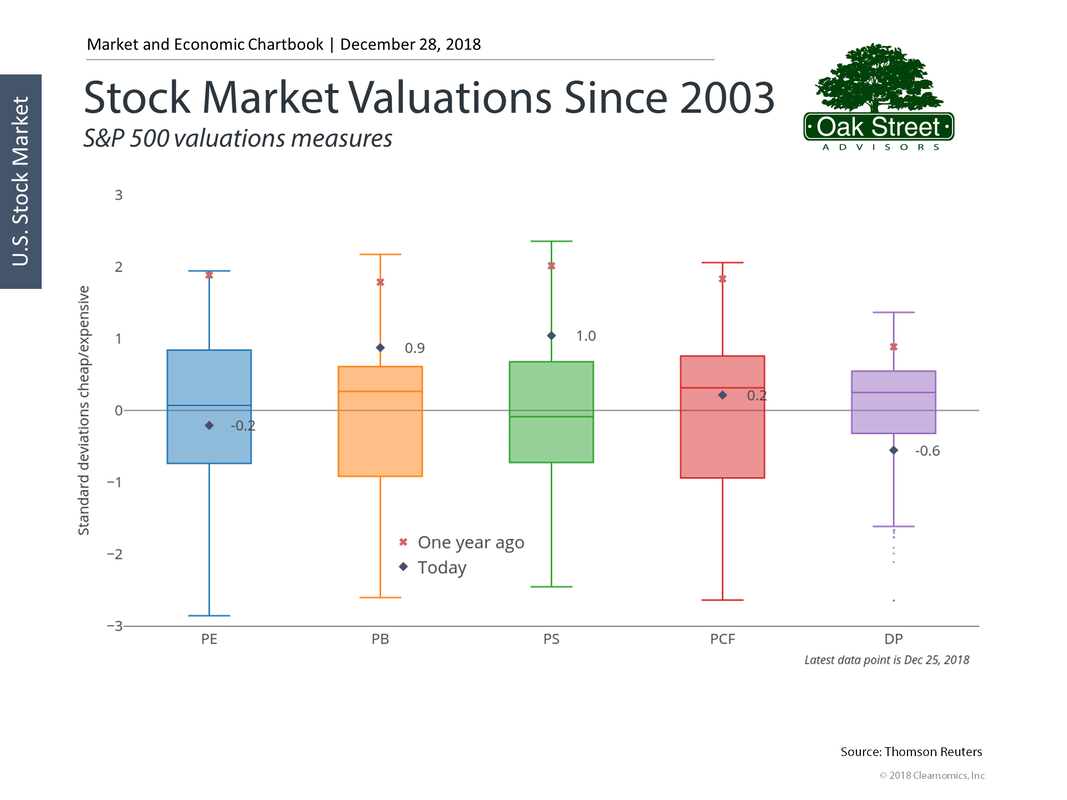 Have equity valuations fallen enough to make stocks a compelling value? No one knows for sure, but investors should keep in mind that their default position should always be to remain fully invested. Remember, the price of the long-term gains historically inherent in the equity markets is the short-term pain caused by corrections along the way. Investor sentiment remains muted, offering more good news for contrarian investors.  Earnings among the companies in the S&P 500 continues to grow at a torrid pace. Lower corporate tax rates have fueled stock buyback programs that allow corporate earnings per share to grow faster than the economic growth generated by normal business operations. I would expect to see a slowdown in the rate of earnings growth later in 2019, as year over year comparisons get tougher, and interest rate increases continue to take a toll on earnings growth. That does not mean we expect earnings to fall, just that the rate of growth will moderate as 2019 progresses. 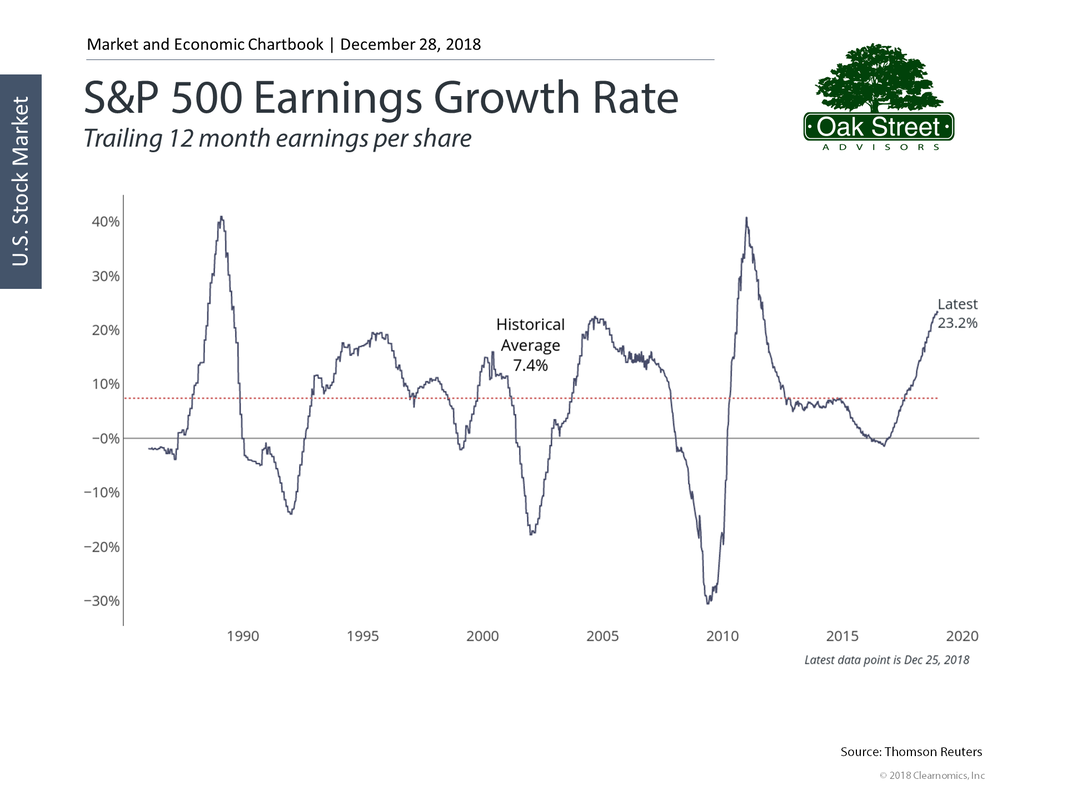 2018 was also something of a dud for foreign stock investors. Developed markets produced even lower returns for US investors than did the domestic market. 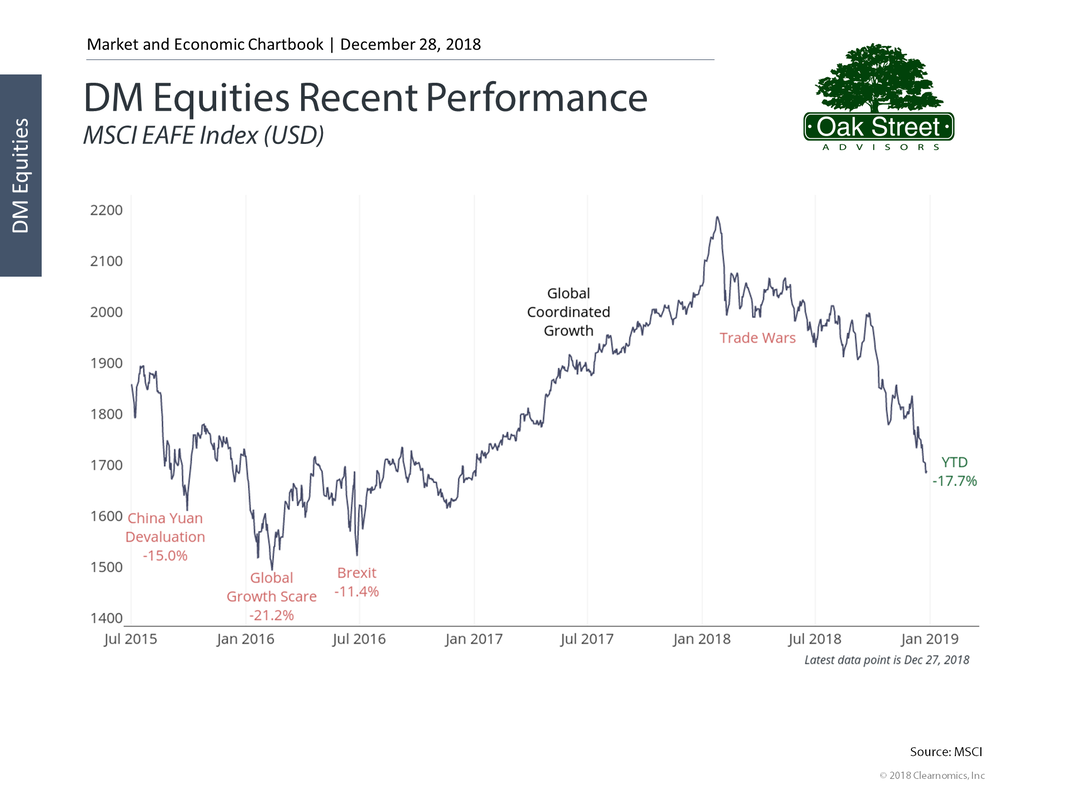 And emerging markets were equally as disappointing. 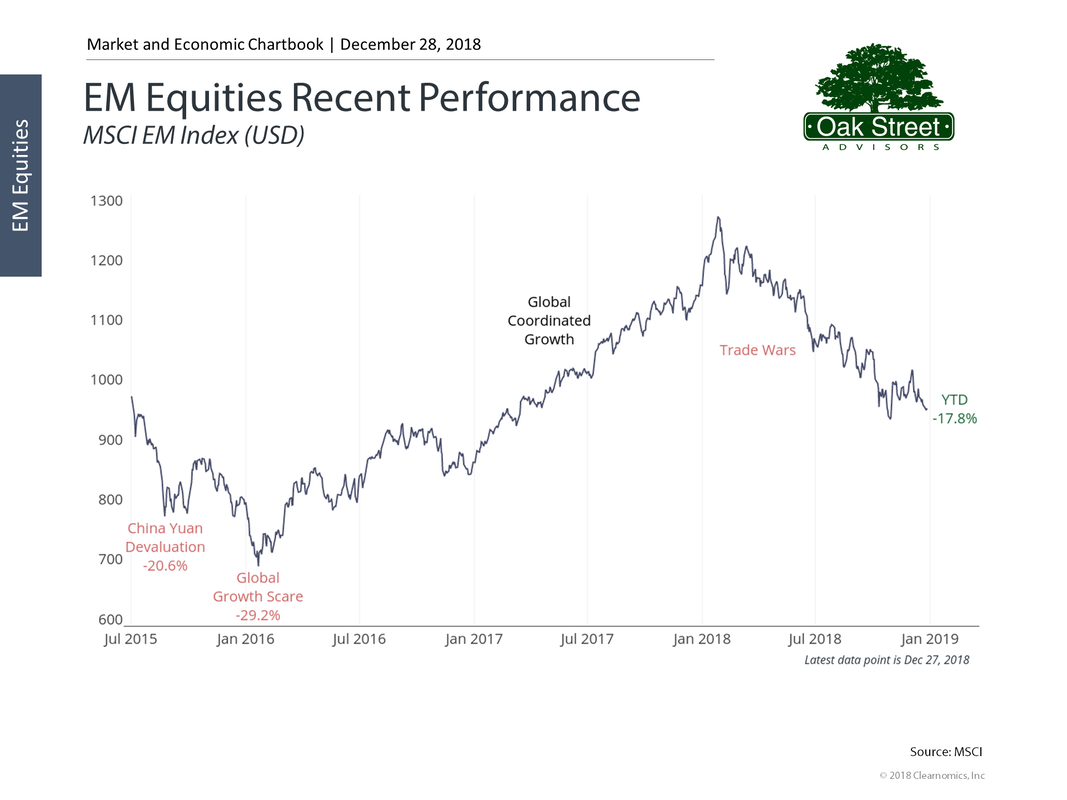 For 2019, we expect both trends to continue. Higher interest rates will generally lead to a stronger dollar and a stronger headwind for non-dollar denominated investments. In 2018, the dollar rose by about 3.5% versus the Euro and about 5% versus the Chinese Yuan. That means investors in the Eurozone needed a 3.5% gain to remain even when they convert their Euro based investments back to US dollars and investors in Chinese companies had a 5% hurdle to clear. 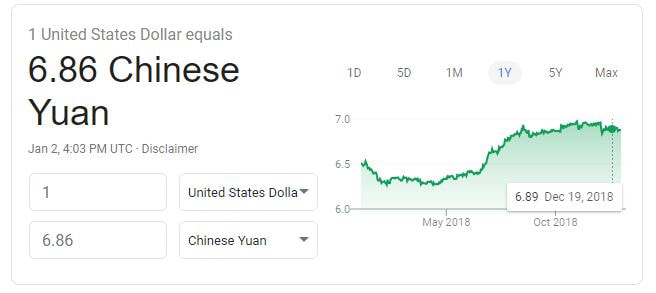 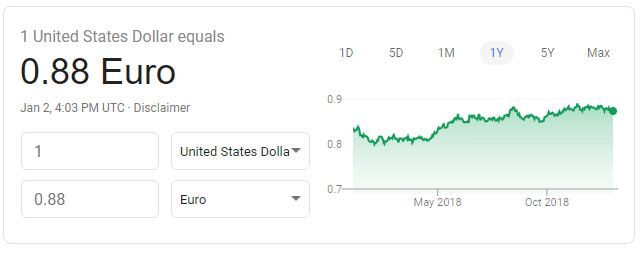 Conclusions At this point we believe investors should focus on US based companies and remain fully invested. Bond durations should remain short, at least for the first half of 2019, as Fed policy is still unclear. If the yield curve does invert, we would take that as a sign to lengthen bond maturities and perhaps reduce our equity holding a bit. You should expect volatility to remain elevated and look at dips as an opportunity. Important: This is not intended as investment advice. We share this so that our clients and prospective clients can understand some of the factors we consider as we implement their investment strategy. Any predictions of future events should be viewed with a skeptical eye. Scary Movie Part 2Just in time for Halloween the stock market has pulled back from its all-time highs and volatility has returned in the form of daily changes of more than 1%. After being up nearly 10% this year, the market- as measured by the S&P 500 index, is flat to slightly down as you read this. 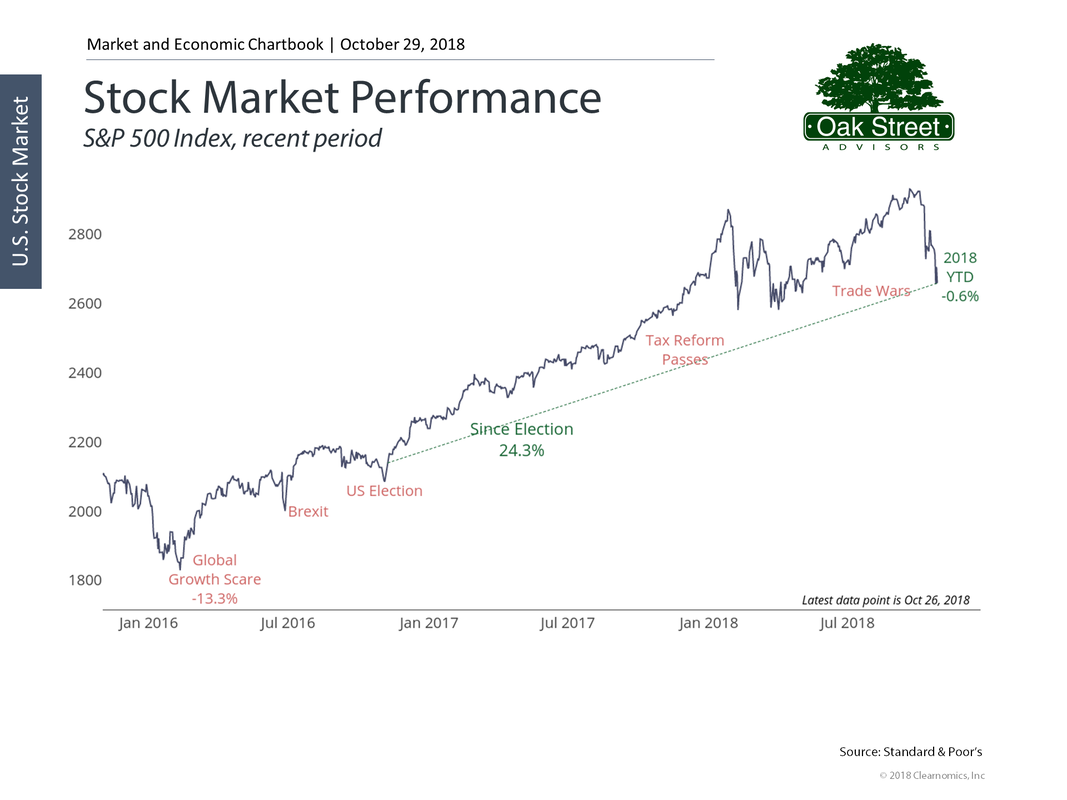 Accompanied by a spike in the VIX Index  Pullbacks in the stock market are common with a linear regression best fit of about 7.5% each year. 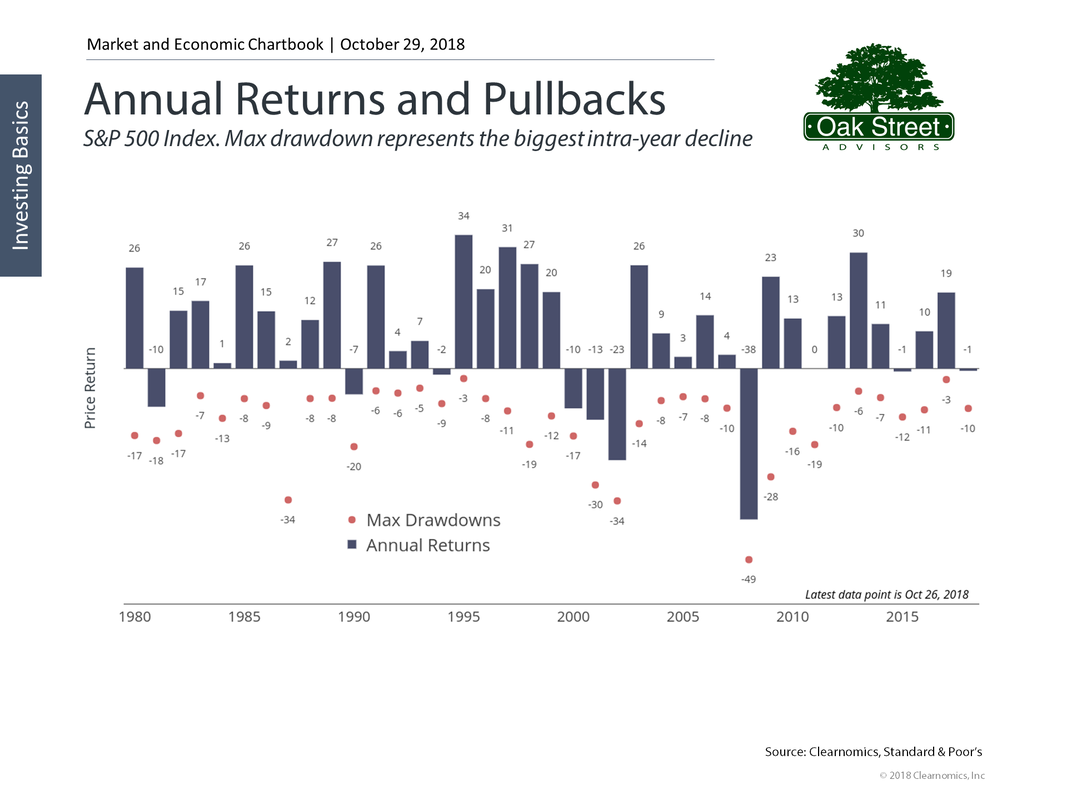 Looking back to 1980, even in years where the market has ended down it has rebounded from the lowest point of the year before year end. With just two months to complete 2018, it is possible that we have already seen the lows for this year. So, despite the recent pullback in stock prices this may well be a lower risk entry point for new investments. If we have in fact seen the intra-year low of -10% (with the market currently down about 1% YTD) downside risk from this point could be minimal. 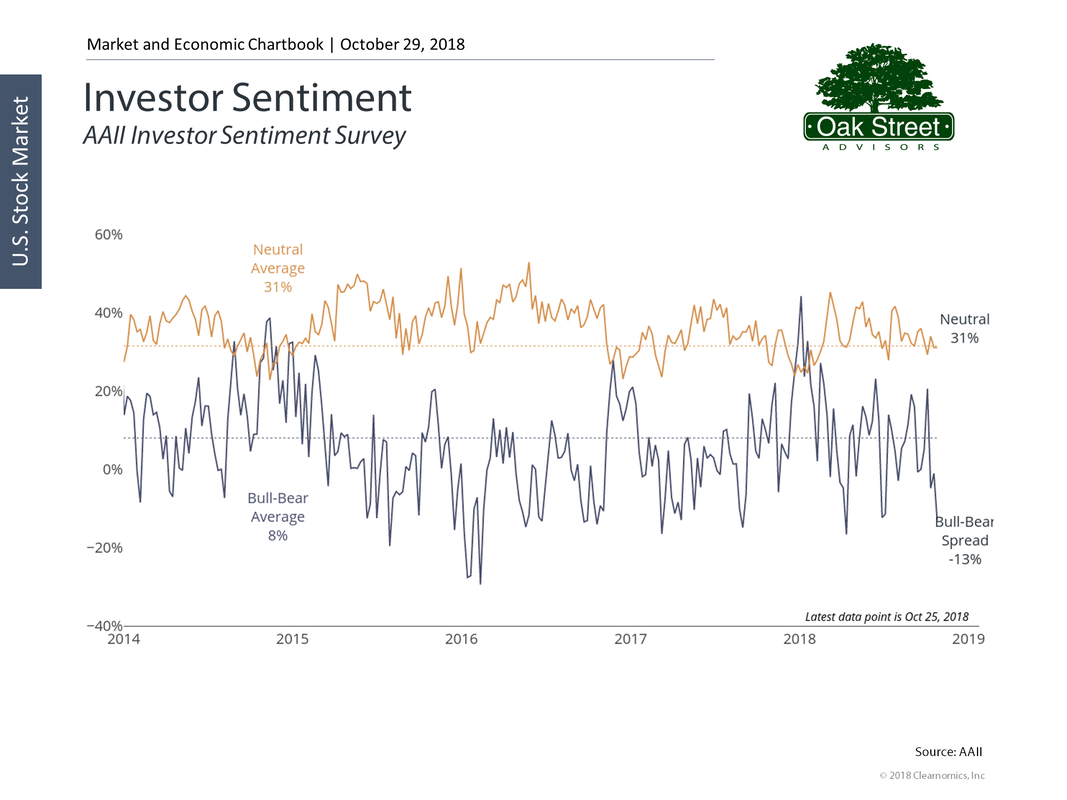 Investor sentiment is tilted slightly to the bearish side, indicating to contrarians that things may not really be so bad. It is unusual for markets to enter bear market territory when investors are negative. It is when you find exuberance for stocks that most of the danger lies. With that said, the earnings of S&P 500 companies have been rising at a torrid pace that is likely not sustainable. The slope of the earnings curve is steep by historical standards, the impact of lower corporate income tax rates will soon be apparent in year-over-year reporting, and rising interest rates tend to act as a brake on economic expansion. Look for S&P 500 earnings growth to continue, but for the pace to slow. 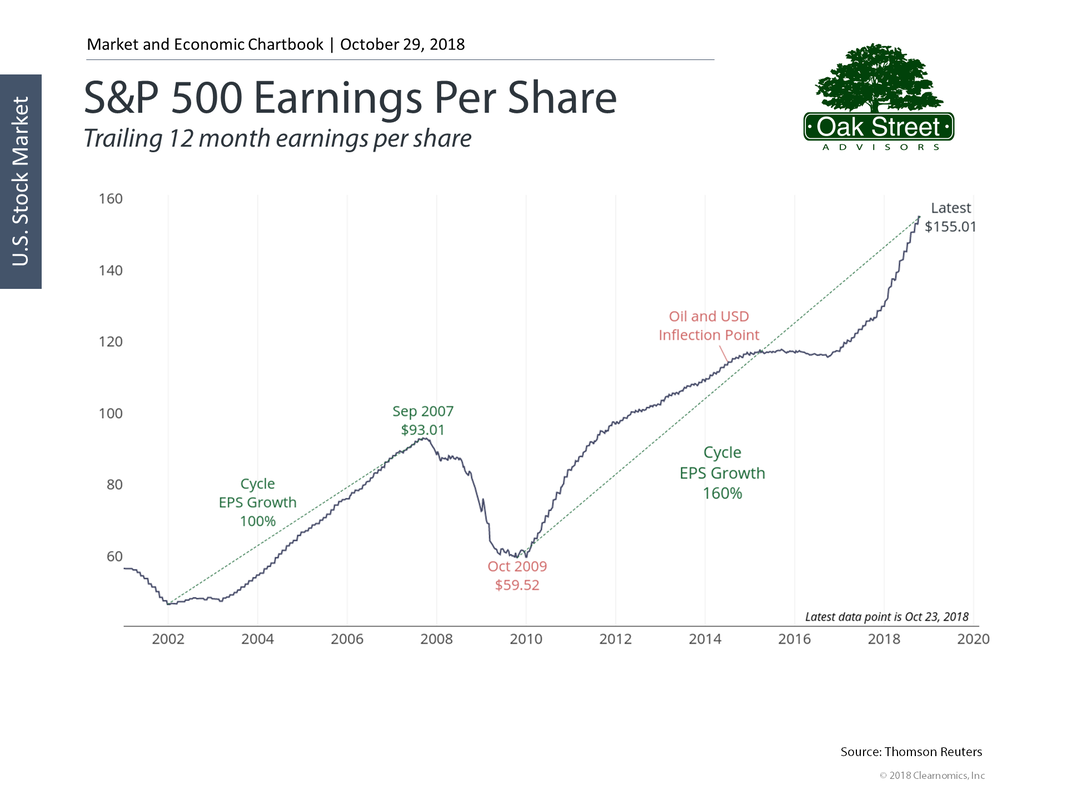  We will likely enter a period when good economic news is interpreted as bad for the stock market-- as unemployment continues to fall, wages finally begin to rise, and federal reserve interest rate increases put pressure on mortgage rates and in turn the housing market. Bonds will continue to be a dangerous place to invest your money as rising rates cause bond prices to fall, and marginal borrowers have trouble issuing new debt at sustainable levels. 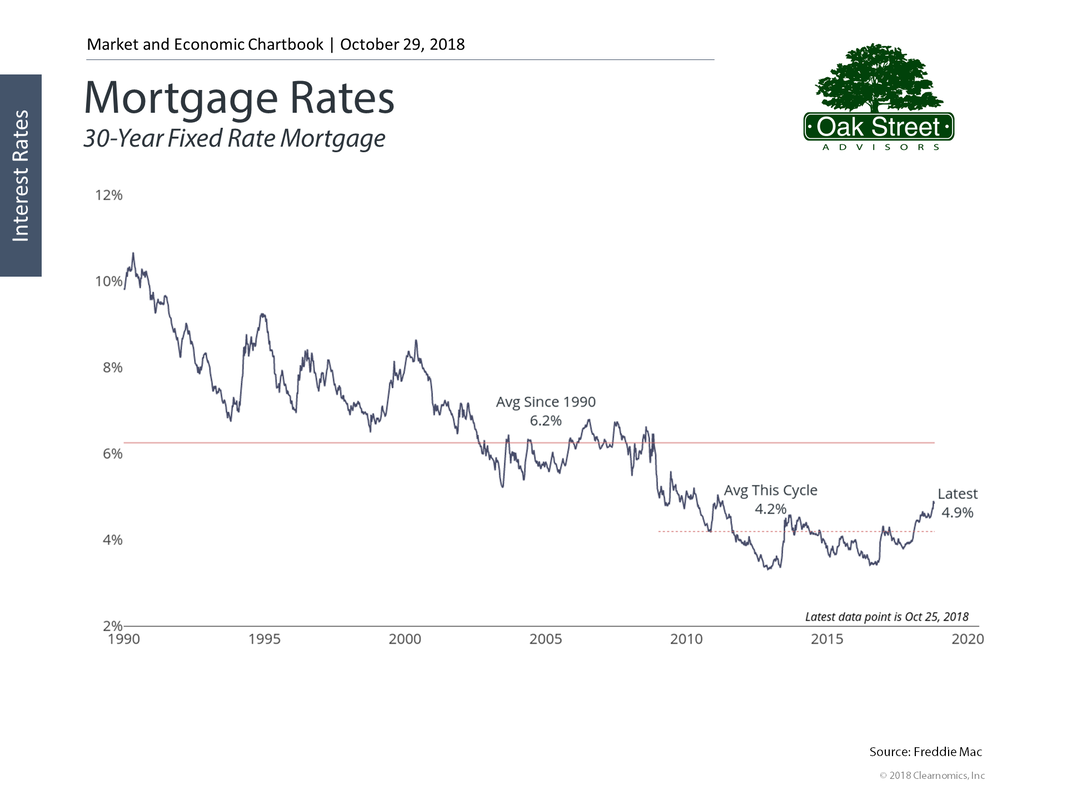 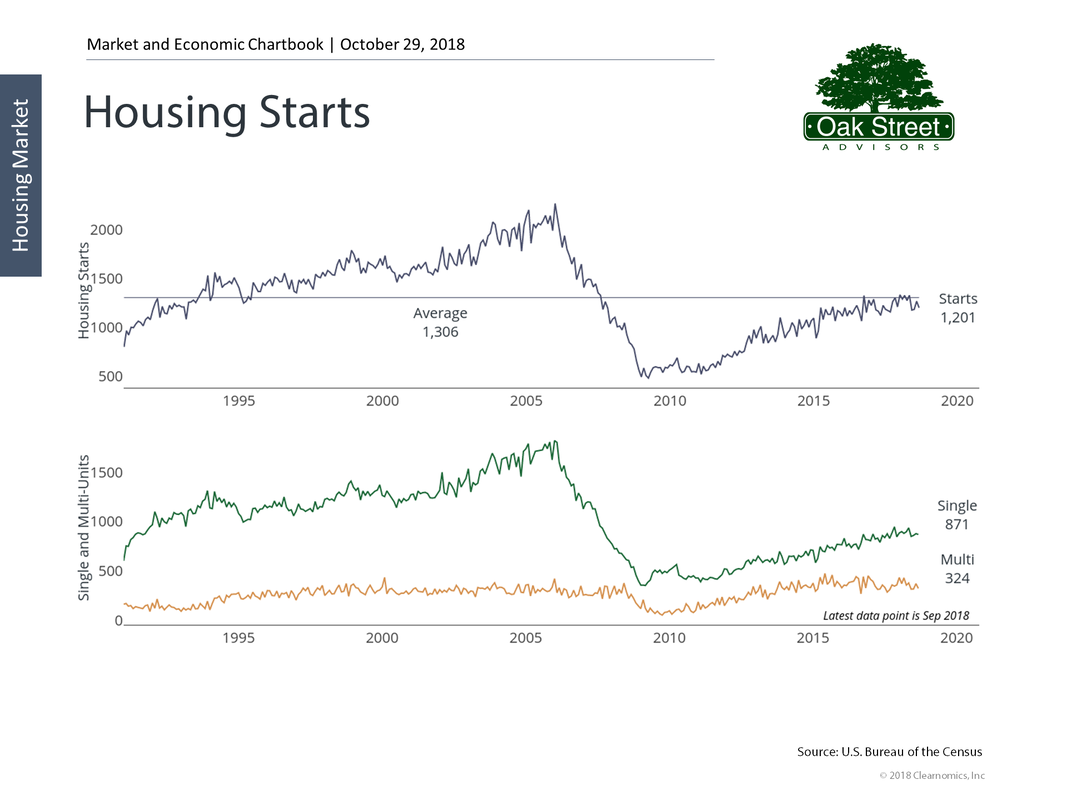 So, as we enter the final two months of the year there are plenty of reasons to worry, but as usual, the long-term prognosis for US equities remains positive.
Like a scary movie you have seen before, conditions will look dire for the hero, but ultimately things will work out in the end.  Imagine its October of 2007. You have spent the last 30-plus years of your life working and saving for this day, the day you retire. You have watched the S&P 500 Index rise steadily over the past five years, climbing from 837.37 to 1561.80, gaining over 12% a year on average. You have watched your 401k grow steadily and feel your nest egg and social security should provide you with a comfortable if not extravagant lifestyle. You work out the numbers and believe withdrawals of about 5% a year should see you through your lifetime.
Then your November statement arrives, and your stock portfolio has dropped 3%. No biggie, we all know stocks fall from time to time. Now its December and your investments shrink another 3%. Okay, you don’t like it, but you have a long time horizon, and know the markets will recover. The January statement arrives, and your nest egg has shrunk another 10%. You are sweating now; a 20% drop means bear market territory. You know you shouldn’t try to time the market, but jeez! February brings another statement that shows another big drop 12%. OMG! What now? By the end of the great recession bear market in March of 2009 your stock investments have fallen a whopping 56%. Within 18 months of retiring your nest egg is already depleted by nearly 60% when you factor in distributions. Welcome to the world of sequence of return risk. Negative market events that can wreck your retirement happen more often than you might think. August 2000 to September 2002 saw the S&P 500 drop 54% over 25 months. January of 1973 to October of 1974 produced a drop of 52% over a 21 month span. December 1968 to June 1970 set you back 33% in 18 months. The greatest market crash of all began October 29, 1929 and lasted an agonizing 38 months. Stock lost 80% of their value and left the US economy in shambles. Yes, the markets recovered from all of these setbacks and went on to reach new record highs, but for those unlucky enough to retire at just the wrong moment, recovery could be forever out of their reach. The math of losses works against you. A 25% drop in market value requires a 33% gain to get back to even. A drop of 33% needs a 50% recovery to reach even, and a 50% drop in value means you need a 100% gain to be even. We all know those kinds of gains take a long time to accumulate. The risk that big market losses occur at the beginning of a withdrawal strategy is called sequence of return risk. If you experience a market return sequence of -10%, -25%, +10%, +25% the net result is you have lost over 7%, the communicative rule of multiplication gives you the same result if the returns are reversed. But! Factor in withdrawals and the picture can change dramatically. Your systematic withdrawals work like dollar cost averaging in reverse. You sell more and more shares to fund your spending at low and lower prices. So how can you protect yourself from such disasters? While there is no strategy that can protect stock investments from going down on occasion, there are some steps you can take to minimize the damage to your long term plan. The first step to avoiding irreparable harm to reaching your long-term goals is to remember that stocks go down, but they don’t stay down. Diversification Having money invested in different asset classes helps. Although the equity portion of your portfolio would have dropped precipitously, owning bonds and holding some cash would reduce the severity of sudden market corrections. Having less exposure to equities will also reduce your returns over time. Still, if you can match an asset allocation to your need for long term returns you might find a ratio that allows you to sleep at night, fund your retirement income, and let you avoid the big mistake of selling at the very bottom of the market. A Separate Bucket for Income Withdrawals- the solution to poor sequence returns Ideally you have planned well for retirement, so instead of having all your retirement nest egg invested for the long term, you have left yourself a cash cushion to fund your anticipated portfolio withdrawal needs for 36 to 48 months, allowing an extra year as a recovery period. Using this strategy your first year withdrawal needs would remain in a money market account and your spending for that first year would come from this account. Your second year of withdrawal needs would invested in one year treasuries or certificates of deposit. So, the second year rolls around and you still don’t have to sweat a bear market, Finally, the third year of anticipated spending is funded with two year treasuries or CDs and the fourth year would be invested in securities maturing in four years. This separate ‘spending bucket’ is what you use for your spending needs. This strategy would necessitate a cash allocation of 3X or 4X your estimated withdrawal rate. If you believe a 5% withdrawal rate will be safe, then 15% to 20% of your portfolio would be allocated to the ‘spending bucket’. If you believe a 4% withdrawal rate is more appropriate, then that implies a 12% to 16% allocation to the ‘spending bucket’. Using this strategy, you could have the confidence to withstand most historical bear markets and corrections. Knowing you do not have to sell stocks when markets a low could give you the edge you need to keep the remainder of your investments intact and allow your portfolio time to rebound. It could also allow the remaining portion of your portfolio to be invested more aggressively, improving the likelihood of higher long-term returns. Don’t Wait Until You Retire For those nearing retirement you should ideally begin implementing and funding this ‘withdrawal bucket’ well before the day you retire. It would be frustrating to see the stock market drop in the year before you plan to retire. Much better if you would begin shifting some of your investment, 401k, 403b, or IRA investments into a safe ‘spending bucket’ three to four years before your targeted retirement date. Four years before retirement you would move one year’s expected spending into a money market or GIC (guaranteed investment contract). Three years before retirement you move another year’s expected spending, and so forth. Then no matter what happens in the market you should be able to retire when you want and have all your withdrawal needs set aside for the four years following retirement and you could invest the remaining balance of your investment or retirement accounts in equities for long term appreciation. This seems to us a better strategy than selecting a target date fund that arbitrarily moves money out of stocks as you approach retirement age. |
Archives
April 2024
Categories
All
|
 RSS Feed